The payments will be paid to the large majority of families living in properties that are classed in council tax bands A to D — in four areas more than 97 per cent of households will receive the payments

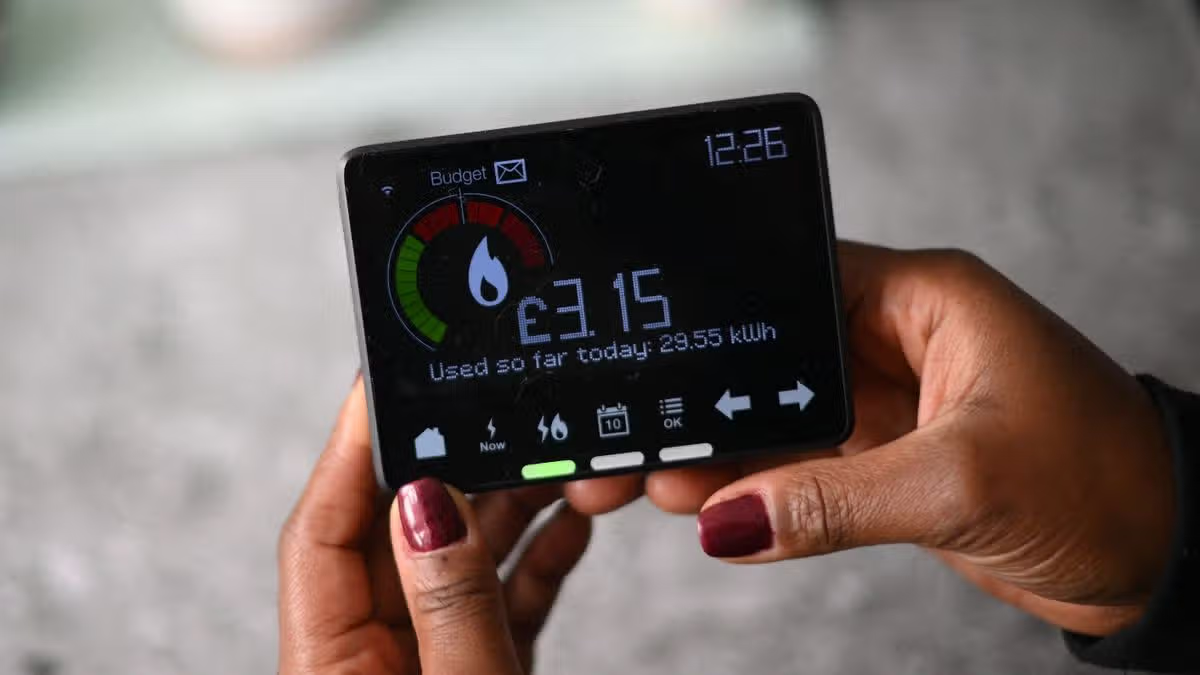
Brits will get some much-needed relief this winter(Image: AFP via Getty Images)
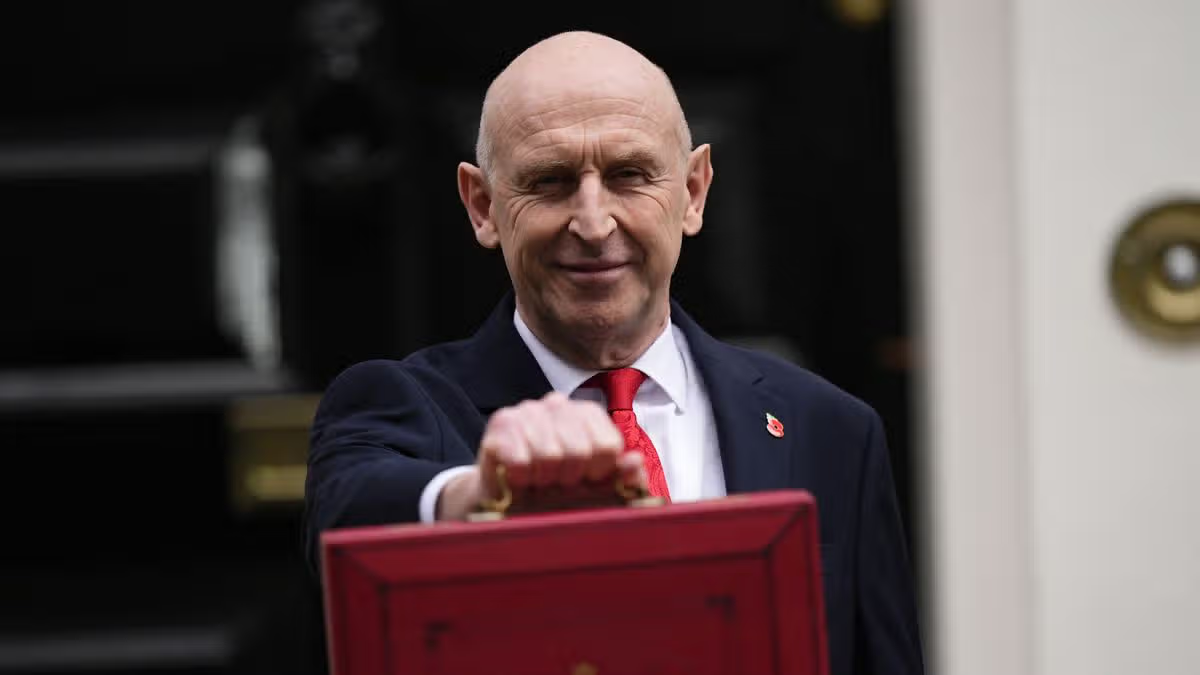
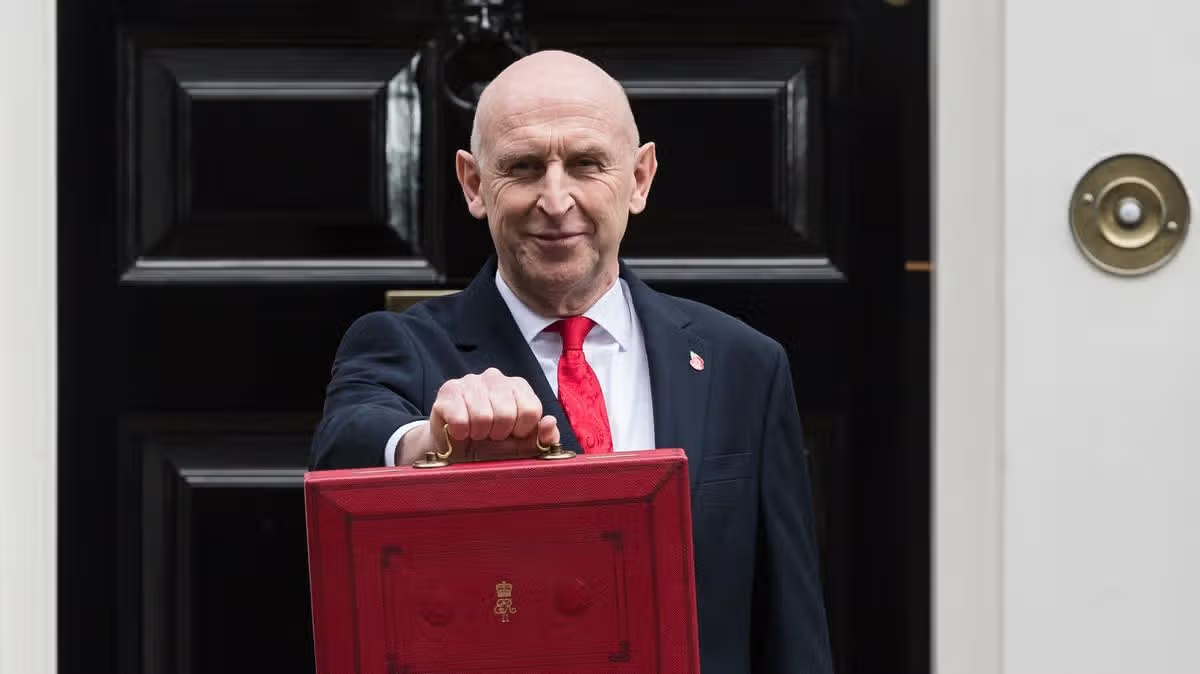
More than 20 million households in England will be paid £100 towards their winter fuel bills in a scheme announced in the budget by Chancellor John Healey.
The payments will be made to the large majority of families in the country living in properties which are classed in council tax bands A-D. In four local authority areas — Hull, Stoke-on-Trent, Sandwell and Barking & Dagenham in London — more than 97 per cent of households will receive the payments.
But in a handful of wealthier areas fewer than half of households will be eligible. The money will be paid out in January and will only apply to homes in England, but Mr Healey said funding would be available for the devolved governments in Scotland, Wales and Northern Ireland to apply similar relief to households this winter
Stay up to date with everything announced in our Budget 2026 live coverage
You can check to see how many homes in your area will be sent the £100 payments in our interactive map below.
After the announcement was made in the Commons the government’s tax service website crashed under the weight of demand from households trying to find out their property council tax band
The Chancellor said the payment, to be paid directly to the bank accounts of households in council tax bands A to D at a cost of £2.6 billion, would give “breathing space” on energy bills.
Mr Healey also announced that the VAT cut on electricity bills is to be extended to July, and gas standing charges are to be shifted to unit rates, with similar reforms to follow for electricity bills.
But critics have said the £100 payment will not provide enough relief against the rise in energy bills predicted for January. Ofgem’s price cap rose by 3.6% to £1,723 for a typical household on October 1, and a further rise of around 22% is forecast in January.
Simon Francis, co-ordinator of the End Fuel Poverty Coalition, said the payment will “barely dent” the predicted rise households face in January. He added: “Because it is paid directly into household accounts in England, it may not even be spent on staying warm this winter.”
Citizens Advice chief executive Dame Clare Moriarty said: “To make a real difference now and beyond, the Government must go further, ensuring support is targeted and reaches those with the greatest energy needs, including families with children and disabled people.”
Full list of council areas in England with number of households set to receive £100 energy payment (number of households in Council tax bands A-D)
- Kingston upon Hull, City of – 123,670 (98.5%)
- Stoke-on-Trent – 117,160 (97.7%)
- Sandwell – 133,250 (97.3%)
- Barking and Dagenham – 79,870 (97.3%)
- Nottingham – 143,200 (96.9%)
- Hyndburn – 36,650 (96.5%)
- Knowsley – 69,420 (96.3%)
- Boston – 30,840 (96.2%)
- Blackpool – 69,900 (96.1%)
- Ashfield – 55,960 (96.1%)
- Liverpool – 232,950 (96.1%)
- Leicester – 139,580 (96.0%)
- South Tyneside – 70,120 (95.9%)
- Burnley – 41,280 (95.7%)
- Bolsover – 37,430 (95.7%)
- Sunderland – 129,040 (95.7%)
- Gateshead – 91,470 (95.6%)
- Lincoln – 45,600 (95.5%)
- Southampton – 106,370 (95.4%)
- Salford – 131,080 (95.4%)
- Mansfield – 49,210 (95.2%)
- Manchester – 241,150 (95.0%)
- Tameside – 100,420 (94.9%)
- Wolverhampton – 108,100 (94.7%)
- North East Lincolnshire – 71,830 (94.6%)
- Barnsley – 109,190 (94.3%)
- Norwich – 65,300 (94.3%)
- Doncaster – 136,600 (94.3%)
- Luton – 80,510 (94.2%)
- Great Yarmouth – 47,340 (94.2%)
- Chesterfield – 48,380 (94.1%)
- Ipswich – 58,880 (94.0%)
- South Holland – 42,330 (93.9%)
- Coventry – 144,210 (93.8%)
- Oldham – 92,870 (93.7%)
- Plymouth – 115,600 (93.7%)
- Cannock Chase – 43,220 (93.6%)
- North Tyneside – 95,550 (93.5%)
- Rotherham – 114,630 (93.5%)
- Portsmouth – 87,980 (93.4%)
- Sheffield – 245,530 (93.4%)
- Blackburn with Darwen – 59,920 (93.3%)
- Wigan – 143,370 (93.2%)
- Middlesbrough – 61,950 (93.2%)
- Derby – 107,230 (93.1%)
- Nuneaton and Bedworth – 57,500 (93.0%)
- St. Helens – 80,150 (92.9%)
- Fenland – 44,900 (92.8%)
- County Durham – 237,580 (92.7%)
- Erewash – 49,350 (92.7%)
- Newham – 123,150 (92.6%)
- Rochdale – 90,910 (92.6%)
- Newcastle upon Tyne – 130,420 (92.4%)
- Walsall – 109,700 (92.4%)
- Dudley – 131,500 (92.4%)
- Redcar and Cleveland – 61,660 (92.3%)
- Wakefield – 152,470 (92.3%)
- Hastings – 41,270 (92.2%)
- Bolton – 118,830 (92.0%)
- North Lincolnshire – 71,920 (91.9%)
- Broxtowe – 48,090 (91.9%)
- East Lindsey – 67,110 (91.8%)
- Gloucester – 55,400 (91.7%)
- Hartlepool – 42,510 (91.6%)
- Birmingham – 428,140 (91.6%)
- Tamworth – 32,210 (91.6%)
- Pendle – 38,180 (91.5%)
- Bristol, City of – 194,910 (91.4%)
- Peterborough – 83,490 (91.1%)
- Cumberland – 126,140 (91.0%)
- Lewisham – 121,920 (90.7%)
- Halton – 53,900 (90.6%)
- Waltham Forest – 100,370 (90.4%)
- Thanet – 63,500 (90.4%)
- Rossendale – 29,650 (90.1%)
- Newcastle-under-Lyme – 52,740 (90.0%)
- Preston – 63,400 (89.9%)
- Gosport – 33,950 (89.6%)
- Calderdale – 87,290 (89.5%)
- Bassetlaw – 51,770 (89.5%)
- Bradford – 200,410 (89.4%)
- Bury – 76,490 (89.4%)
- Darlington – 48,110 (89.3%)
- Wirral – 135,800 (89.2%)
- Kirklees – 172,750 (89.2%)
- North Kesteven – 49,450 (89.1%)
- Adur – 25,870 (89.1%)
- Lancaster – 59,690 (89.0%)
- Leeds – 335,790 (88.9%)
- Telford and Wrekin – 75,290 (88.5%)
- Thurrock – 62,240 (88.4%)
- Harlow – 35,870 (88.4%)
- Worcester – 42,380 (88.2%)
- Slough – 50,560 (88.1%)
- Amber Valley – 54,290 (88.1%)
- Breckland – 58,380 (88.0%)
- North East Derbyshire – 43,200 (88.0%)
- Sefton – 115,630 (87.8%)
- Stevenage – 33,930 (87.7%)
- Stockton-on-Tees – 79,820 (87.7%)
- Tendring – 66,780 (87.6%)
- Gedling – 48,610 (87.5%)
- King’s Lynn and West Norfolk – 66,650 (87.4%)
- Exeter – 53,530 (87.2%)
- South Ribble – 45,610 (86.8%)
- West Lindsey – 40,660 (86.6%)
- Medway – 105,560 (86.6%)
- North Northamptonshire – 140,360 (86.6%)
- Torbay – 59,580 (86.5%)
- Redditch – 32,730 (86.2%)
- Rushmoor – 36,990 (86.1%)
- Wyre Forest – 42,350 (86.0%)
- Oadby and Wigston – 21,180 (86.0%)
- Crawley – 40,640 (85.9%)
- Brighton and Hove – 116,850 (85.6%)
- Cornwall – 246,410 (85.6%)
- Broadland – 53,990 (85.6%)
- Reading – 66,050 (85.4%)
- Southend-on-Sea – 71,030 (85.2%)
- York – 79,900 (85.1%)
- Swindon – 87,210 (85.1%)
- Torridge – 29,500 (85.1%)
- West Suffolk – 71,860 (84.9%)
- Blaby – 38,010 (84.6%)
- Northumberland – 137,950 (84.6%)
- Swale – 57,140 (84.6%)
- South Kesteven – 57,260 (84.6%)
- Newark and Sherwood – 49,700 (84.5%)
- North Norfolk – 47,970 (84.5%)
- Hinckley and Bosworth – 44,710 (84.4%)
- Greenwich – 106,110 (84.4%)
- Eastbourne – 42,040 (84.2%)
- North Devon – 41,650 (84.1%)
- Dover – 47,240 (84.1%)
- Warrington – 81,600 (83.8%)
- Hackney – 101,120 (83.6%)
- High Peak – 36,710 (83.6%)
- East Staffordshire – 47,240 (83.6%)
- Staffordshire Moorlands – 37,800 (83.5%)
- North Warwickshire – 24,910 (83.5%)
- Havant – 47,800 (83.3%)
- Charnwood – 66,460 (83.2%)
- East Suffolk – 102,400 (83.1%)
- Isle of Wight – 60,890 (83.1%)
- Chorley – 44,310 (83.1%)
- Trafford – 86,470 (82.8%)
- North West Leicestershire – 40,850 (82.6%)
- Worthing – 42,990 (82.6%)
- East Riding of Yorkshire – 138,270 (82.6%)
- South Gloucestershire – 106,470 (82.4%)
- Stockport – 109,890 (82.2%)
- Wyre – 46,160 (82.1%)
- Gravesham – 37,110 (82.0%)
- South Derbyshire – 41,960 (81.9%)
- Cheltenham – 47,150 (81.9%)
- Castle Point – 32,450 (81.8%)
- Watford – 35,350 (81.3%)
- West Lancashire – 43,020 (81.2%)
- Basildon – 65,190 (81.2%)
- Milton Keynes – 103,250 (81.1%)
- Folkestone and Hythe – 43,720 (81.1%)
- Colchester – 70,350 (81.0%)
- West Northamptonshire – 150,710 (80.8%)
- South Norfolk – 54,950 (80.8%)
- Forest of Dean – 33,020 (80.5%)
- Westmorland and Furness – 94,890 (80.5%)
- Stafford – 51,740 (80.4%)
- Haringey – 92,080 (80.2%)
- Bournemouth, Christchurch and Poole – 151,940 (79.8%)
- Canterbury – 57,760 (79.7%)
- Huntingdonshire – 67,040 (79.6%)
- East Cambridgeshire – 33,130 (79.5%)
- Somerset – 216,180 (79.3%)
- Rugby – 41,330 (79.1%)
- Eastleigh – 48,610 (78.9%)
- Shropshire – 120,620 (78.9%)
- Babergh – 34,890 (78.4%)
- Melton – 19,820 (78.3%)
- Cheshire West and Chester – 130,230 (77.9%)
- Braintree – 55,230 (77.5%)
- Mid Devon – 30,010 (77.5%)
- Bedford – 62,760 (77.3%)
- Cambridge – 47,130 (77.3%)
- Teignbridge – 50,600 (77.3%)
- Mid Suffolk – 39,010 (76.9%)
- Oxford – 49,060 (76.8%)
- Lambeth – 114,060 (76.8%)
- Southwark – 115,540 (76.8%)
- Cherwell – 55,550 (76.6%)
- North Somerset – 78,200 (76.4%)
- Dartford – 38,660 (76.2%)
- South Staffordshire – 37,520 (75.9%)
- Havering – 82,580 (75.8%)
- Fylde – 31,540 (75.5%)
- West Devon – 20,760 (75.4%)
- North Yorkshire – 231,160 (75.3%)
- Brent – 101,780 (75.1%)
- Lichfield – 37,160 (75.0%)
- Hounslow – 83,500 (75.0%)
- Rochford – 28,750 (74.8%)
- Central Bedfordshire – 100,870 (74.7%)
- Bath and North East Somerset – 64,980 (74.6%)
- Stroud – 42,640 (74.5%)
- Arun – 59,510 (74.5%)
- Lewes – 35,180 (74.2%)
- Bexley – 75,120 (73.8%)
- Croydon – 124,580 (73.8%)
- Tewkesbury – 34,290 (73.6%)
- Fareham – 37,740 (73.6%)
- Herefordshire, County of – 66,280 (73.1%)
- Wiltshire – 170,210 (72.9%)
- Basingstoke and Deane – 59,800 (72.8%)
- North Hertfordshire – 43,730 (72.7%)
- Rushcliffe – 40,200 (72.4%)
- Warwick – 50,470 (72.1%)
- Sutton – 62,300 (72.1%)
- Cheshire East – 137,280 (71.7%)
- Chelmsford – 58,900 (71.7%)
- Redbridge – 77,140 (71.3%)
- Dorset – 133,660 (71.2%)
- Maidstone – 56,060 (71.1%)
- Ashford – 42,300 (71.1%)
- Solihull – 68,220 (71.0%)
- Merton – 62,340 (71.0%)
- Welwyn Hatfield – 36,120 (70.9%)
- Hillingdon – 83,600 (70.7%)
- Ealing – 106,100 (70.7%)
- Enfield – 90,200 (70.2%)
- West Oxfordshire – 38,040 (70.1%)
- East Devon – 52,730 (70.0%)
- Derbyshire Dales – 24,900 (69.6%)
- Rutland – 12,600 (69.1%)
- Ribble Valley – 20,500 (68.7%)
- Bracknell Forest – 37,720 (68.7%)
- Malvern Hills – 26,680 (68.6%)
- New Forest – 57,370 (68.6%)
- Dacorum – 46,770 (68.5%)
- Rother – 32,140 (68.4%)
- Test Valley – 40,310 (68.3%)
- Broxbourne – 28,940 (68.1%)
- Wychavon – 42,570 (68.1%)
- Tower Hamlets – 102,580 (68.1%)
- Maldon – 20,850 (68.1%)
- South Hams – 32,610 (68.0%)
- Harborough – 30,430 (67.5%)
- West Berkshire – 48,540 (67.1%)
- Bromsgrove – 28,850 (66.7%)
- Islington – 74,170 (66.0%)
- Vale of White Horse – 42,390 (65.4%)
- Tunbridge Wells – 34,310 (64.7%)
- South Cambridgeshire – 48,250 (64.5%)
- Tonbridge and Malling – 36,880 (63.7%)
- Stratford-on-Avon – 43,040 (63.5%)
- Woking – 27,990 (62.6%)
- South Oxfordshire – 42,150 (62.5%)
- Wealden – 46,980 (62.2%)
- Chichester – 38,400 (62.0%)
- Spelthorne – 27,690 (61.7%)
- Mid Sussex – 43,570 (61.5%)
- Cotswold – 28,470 (61.5%)
- East Hampshire – 34,570 (61.0%)
- Winchester – 35,950 (60.8%)
- Runnymede – 23,910 (60.4%)
- East Hertfordshire – 41,160 (60.3%)
- Harrow – 58,310 (60.1%)
- Kingston upon Thames – 41,140 (58.3%)
- Wandsworth – 92,440 (58.3%)
- Hertsmere – 26,370 (57.3%)
- Epping Forest – 33,650 (57.3%)
- Reigate and Banstead – 36,930 (56.8%)
- Guildford – 35,630 (56.8%)
- Buckinghamshire – 135,280 (56.6%)
- Horsham – 37,710 (56.4%)
- Bromley – 79,800 (55.5%)
- Sevenoaks – 29,260 (55.4%)
- Brentwood – 19,640 (55.4%)
- Camden – 63,050 (55.3%)
- Uttlesford – 22,520 (55.0%)
- Hart – 23,230 (54.0%)
- Hammersmith and Fulham – 51,190 (53.5%)
- Barnet – 85,500 (53.1%)
- Wokingham – 39,580 (52.6%)
- Three Rivers – 20,330 (51.9%)
- Surrey Heath – 20,000 (51.7%)
- Waverley – 29,180 (50.4%)
- Windsor and Maidenhead – 33,660 (49.7%)
- St Albans – 31,200 (49.1%)
- Epsom and Ewell – 16,330 (49.0%)
- Tandridge – 17,790 (46.4%)
- Mole Valley – 17,400 (43.6%)
- Richmond upon Thames – 36,980 (43.1%)
- Elmbridge – 24,720 (41.0%)
- Isles of Scilly – 430 (36.8%)
- Westminster – 46,850 (35.4%)
- Kensington and Chelsea – 28,390 (31.7%)
- City of London – 1,990 (24.7%)